 |
| Terms You
Must Know - A
Specialist in Technical Analysis |
|
|
 |
|
Converging Trends - Converging trends can take
3 possible shapes: A converging trend with a bias
to increase, a converging trend with a bias to decrease,
and an unbiased converging trend.
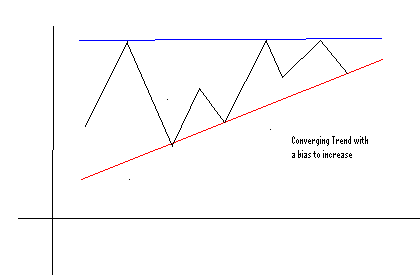
1. A converging trend with a bias to increase
is seen when the trend lines, and therefore the trading
channel, of a particular stock or Index has a flat upper
trend line, and an increasing lower trend line.
This type of pattern usually suggests that the resistance
at that upper trend line is strong, but it also tells
us that there is a bias in the security to increase.
The pattern tells us to expect the volatility in the
Index to slow as the trend converges, but it also tells
us that is the resistance line breaks accelerated moves
higher could come fast. See the example below.

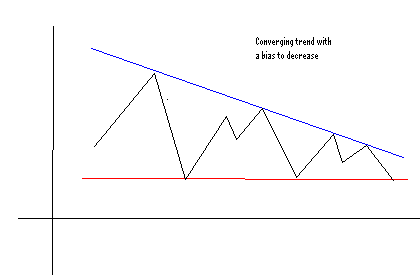
2. A converging trend with a bias to decrease
is seen when the trend lines, and therefore the trading
channel, of a particular stock or Index has a flat lower
trend line, and a decreasing upper trend line.
This type of pattern usually suggests that the support
at that lower trend line is strong, but it also tells
us that there is a bias in the security to decline.
The pattern tells us to expect the volatility in the
Index to slow as the trend converges, but it also tells
us that is the support line breaks accelerated moves
lower could come fast. See the example below.

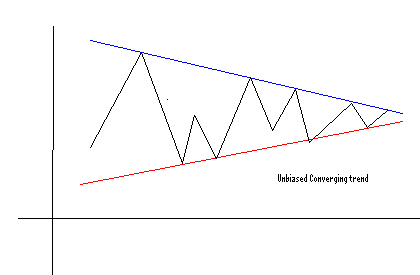
3. An unbiased converging trend is seen
when both the upper and lower trend lines of a trading
channel converge together to meet in the middle of the
channel. In this case neither of the trend lines
are flat. The upper trend line is decreasing and
the lower trend line is increasing. This tells
us that the volatility in the security is waning.
In addition it is telling us that the support and resistance
lines in the stock are equally as strong. This
in turn tells us to be prepared for accelerated moves
in either direction depending on a break of either trend
line. If the resistance line breaks accelerated
moves higher are likely, but if the support line breaks
accelerated moves lower are likely. See the example
below.

|
| |