For June 23, 2005
(Individual Chart Analysis)
Summary of the Technical Analysis for the NASDAQ
(This takes into account the near term, mid term, and
longer term charts)
These charts are telling us to expect the market to
begin the day with a bias to increase as it opens on
Thursday and they tell us to expect re-tests of 2100.
However, this assumes that 2085 holds as support.
Any break below 2085 is likely to be met with added
selling pressure. If 2085 breaks lower expect
a Market decline to near 2070. If 2085 remains
in tact as support, expect increases to near 2100 again
instead. 2085 should be considered inflection
on Thursday.
| Initial intraday trading parameters
for the NASDAQ exist between 2085 - 2100 |
| If 2085 breaks lower expect 2070 |
| If 2100 breaks higher expect
2190 |
| Otherwise expect 2085 - 2100 to hold |
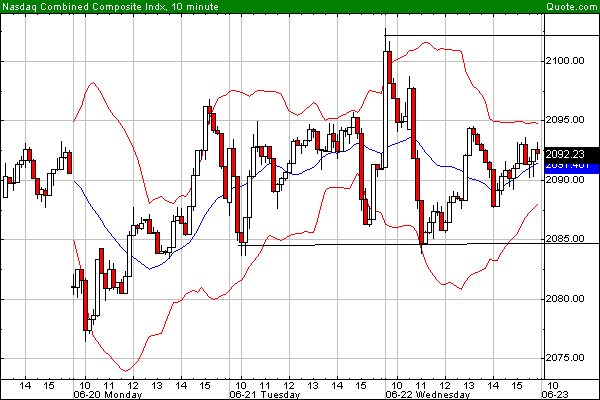
Near
Term Chart Analysis for the NASDAQ
This charts is telling us that the Market is in a near
term neutral channel and it suggests that the Market
has recently tested a level of support. This chart
shows us that the trading range is tightening, but it
also tells us to expect the markets to trend higher
from current levels until such time as 2102 is tested
again.
Near Term Support for the NASDAQ exists at 2085
Near Term Resistance for the NASDAQ exists at 2102

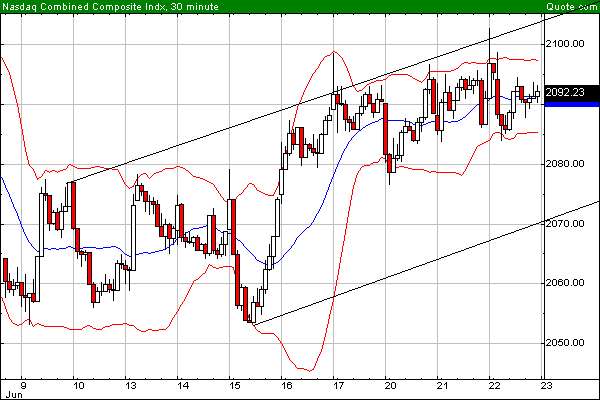
Mid Term
Chart Analysis for the NASDAQ
This charts suggests that the market is in a mid term
up-channel and it suggests that the Market has recently
tested a level of resistance. This chart, in turn,
tells us to expect the market to decline from current
levels until such time as 2070 is tested again.
Mid Term Support for the NASDAQ exists at 2070
Mid Term Resistance for the NASDAQ exists at 2105

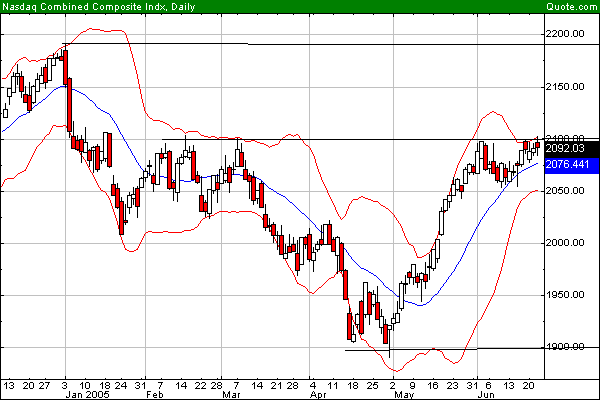
Longer
Term Chart Analysis for the NASDAQ
This chart tells us that the Market is facing intra-channel
resistance at 2100. Eventual breaks above 2100
appear likely over time as the Market increases towards
2195, but a pullback appears likely so long as 2100
holds as resistance (albeit temporary).
Longer Term Support for the NASDAQ exists at 1900
Longer Term Resistance for the NASDAQ exists at 2195.

|