EPS CHART
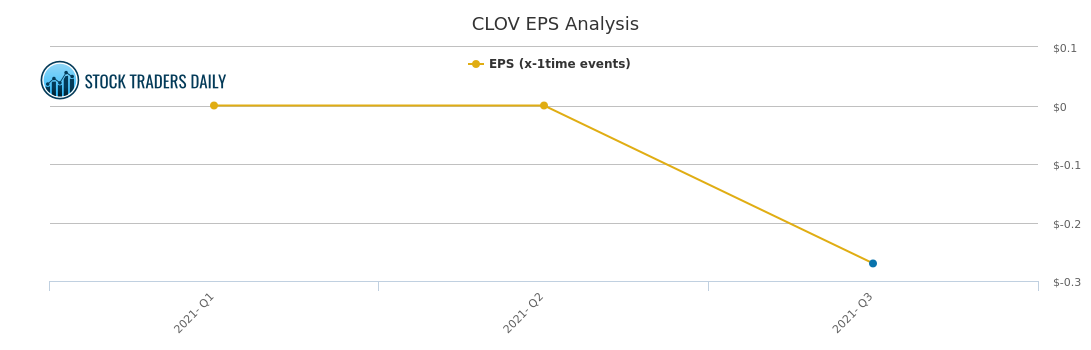
Clov (CLOV) — EPS
Fundamental data and historical chart analysis for Clov — powered by Stock Traders Daily research.
CLOV EPS Chart
Updated daily
What is EPS?
Earnings Per Share (EPS) measures the portion of a company's net profit allocated to each outstanding share of common stock. It is calculated by dividing net income by the total number of shares outstanding and is one of the most widely used metrics for evaluating a company's profitability.
Why Does It Matter?
EPS allows investors to compare profitability across companies of different sizes on a per-share basis. A rising EPS over time generally indicates that a company is becoming more profitable, which tends to support a higher stock price. Declining EPS can signal deteriorating business conditions.
How to Read the Chart
The EPS chart uses a trailing twelve month (TTM) figure, which smooths out seasonal variations by always looking at the most recent full year of earnings. A rising line indicates improving profitability. A flat or declining line warrants closer examination of the underlying business.
What Causes EPS to Change?
EPS can rise due to higher revenues, improved profit margins, cost reductions, or share buybacks that reduce the number of shares outstanding. It can fall due to revenue declines, rising costs, or dilution from new share issuances.
Past Coverage
News & Analysis — CLOV
November 12, 2023
When the Price of Clover Health Investments Corp. Class A $CLOV Talks, People Listen
Read article →
November 03, 2023
Clover Health Investments Corp. Class A ($CLOV) Trading Report
Read article →
October 24, 2023
Clover Health Investments Corp. Class A $CLOV Trading Report
Read article →
October 15, 2023
Learn to Evaluate Clover Health Investments Corp. Class A ($CLOV) using the Charts
Read article →
October 05, 2023
When Clover Health Investments Corp. Class A ($CLOV) Moves Investors should Listen
Read article →
September 25, 2023
Clover Health Investments Corp. Class A ($CLOV) Trading Report
Read article →
September 16, 2023
Clover Health Investments Corp. Class A ($CLOV) Trading Report
Read article →
September 06, 2023
Clover Health Investments Corp. Class A $CLOV Investment Report
Read article →
August 28, 2023
Clover Health Investments Corp. Class A $CLOV Trading Advice
Read article →
August 18, 2023
Clover Health Investments Corp. Class A $CLOV Technical Pivots with Risk Controls
Read article →
August 08, 2023
Clover Health Investments Corp. Class A $CLOV Pivots Trading Plans and Risk Controls
Read article →
July 30, 2023
Clover Health Investments Corp. Class A $CLOV Trading Signals
Read article →
July 20, 2023
Clover Health Investments Corp. Class A $CLOV Investment Analysis and Advice
Read article →
July 11, 2023
Clover Health Investments Corp. Class A $CLOV Proactive Strategies
Read article →
July 01, 2023
When the Price of Clover Health Investments Corp. Class A $CLOV Talks, People Listen
Read article →
Our Specialized Tools
Institutional-Grade Research
Risk Control
Evitar Corte
Protection from market crashes. We help investors identify every crash since 2000, in advance, using our proprietary model.
Learn more →
Macro Indicator
The Investment Rate (IR)
A measure of natural liquidity. The IR identified the bookends of every long-term stock market cycle since 1900.
Learn more →
Strategy
Investment Approach
With a macro foundation, we offer actionable investment strategies that allow clients to make money in any market environment.
Learn more →