P/E CHART
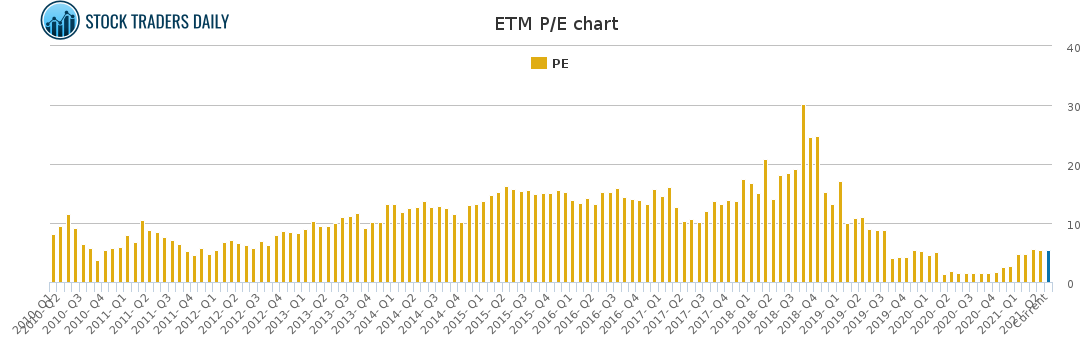
Entercom Communications (ETM) — P/E
Fundamental data and historical chart analysis for Entercom Communications — powered by Stock Traders Daily research.
ETM P/E Chart
Updated daily
What is the P/E Ratio?
The Price to Earnings ratio (P/E) compares a company's current share price to its earnings per share. It answers the question: how much are investors willing to pay for every dollar of earnings this company produces? A P/E of 20 means investors are paying $20 for every $1 of annual earnings.
Why Does It Matter?
The P/E ratio is the most widely used valuation metric in investing. It helps investors determine whether a stock is expensive or cheap relative to its earnings. Comparing a company's current P/E to its own historical average, its industry peers, or the broader market provides important context about valuation.
How to Read the Chart
A rising P/E can mean the stock price is increasing faster than earnings — which may indicate overvaluation or high investor optimism about future growth. A falling P/E can indicate the stock is becoming cheaper relative to earnings, either because the price has fallen or earnings have grown. Very high P/E ratios require strong future growth to justify the valuation.
What Influences the P/E Ratio?
Interest rates, growth expectations, industry dynamics, and overall market sentiment all affect P/E ratios. In low interest rate environments, P/E ratios tend to be higher across the market. In high rate environments, investors typically demand lower valuations.
Past Coverage
News & Analysis — ETM
May 04, 2021
How to Develop Investment Plans for Invalid Iqfeed Symbol #ETM
Read article →
April 23, 2021
How to Evaluate Invalid Iqfeed Symbol $ETM by Looking at the Charts
Read article →
April 13, 2021
Stimulus Matters to the Stock Market and to Invalid Iqfeed Symbol $ETM
Read article →
April 04, 2021
How Stock Traders Daily uses Price Action in Entercom Communications $ETM to Define Opportunity and Risk
Read article →
March 25, 2021
How to Identify the Opportunity and Potential Pitfalls in Entercom Communications $ETM
Read article →
March 16, 2021
When Entercom Communications $ETM Moves Investors should Listen
Read article →
March 07, 2021
How to Evaluate Entercom Communications $ETM by Looking at the Charts
Read article →
February 26, 2021
Political Decisions Influence Entercom Communications $ETM and Investors Should Listen
Read article →
February 16, 2021
Using the Action in Entercom Communications $ETM to our Advantage
Read article →
February 07, 2021
How to trade Entercom Communications $ETM With Risk Controls
Read article →
January 29, 2021
How to trade Entercom Communications $ETM With Risk Controls
Read article →
January 19, 2021
How to trade Entercom Communications $ETM With Risk Controls
Read article →
January 10, 2021
How to trade Entercom Communications $ETM With Risk Controls
Read article →
January 01, 2021
How to trade Entercom Communications $ETM With Risk Controls
Read article →
December 22, 2020
How to trade Entercom Communications $ETM With Risk Controls
Read article →
Our Specialized Tools
Institutional-Grade Research
Risk Control
Evitar Corte
Protection from market crashes. We help investors identify every crash since 2000, in advance, using our proprietary model.
Learn more →
Macro Indicator
The Investment Rate (IR)
A measure of natural liquidity. The IR identified the bookends of every long-term stock market cycle since 1900.
Learn more →
Strategy
Investment Approach
With a macro foundation, we offer actionable investment strategies that allow clients to make money in any market environment.
Learn more →