EPS CHART
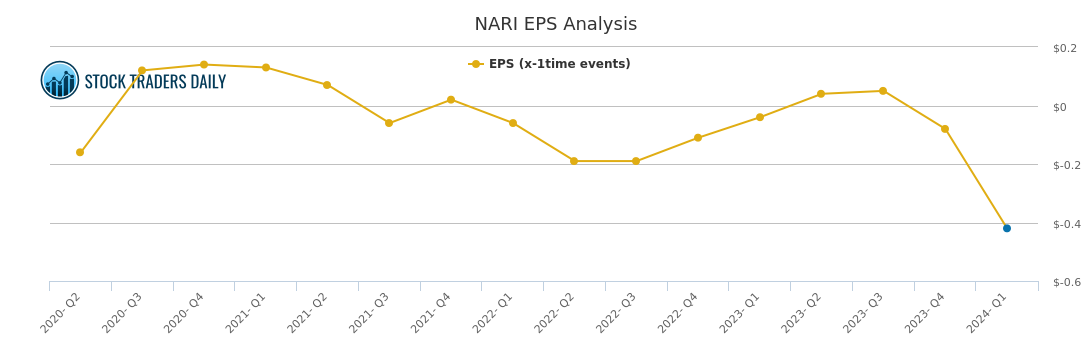
Inari Medical . (NARI) — EPS
Fundamental data and historical chart analysis for Inari Medical . — powered by Stock Traders Daily research.
NARI EPS Chart
Updated daily
What is EPS?
Earnings Per Share (EPS) measures the portion of a company's net profit allocated to each outstanding share of common stock. It is calculated by dividing net income by the total number of shares outstanding and is one of the most widely used metrics for evaluating a company's profitability.
Why Does It Matter?
EPS allows investors to compare profitability across companies of different sizes on a per-share basis. A rising EPS over time generally indicates that a company is becoming more profitable, which tends to support a higher stock price. Declining EPS can signal deteriorating business conditions.
How to Read the Chart
The EPS chart uses a trailing twelve month (TTM) figure, which smooths out seasonal variations by always looking at the most recent full year of earnings. A rising line indicates improving profitability. A flat or declining line warrants closer examination of the underlying business.
What Causes EPS to Change?
EPS can rise due to higher revenues, improved profit margins, cost reductions, or share buybacks that reduce the number of shares outstanding. It can fall due to revenue declines, rising costs, or dilution from new share issuances.
Past Coverage
News & Analysis — NARI
July 15, 2026
(NARI) Movement Within Algorithmic Entry Frameworks
Read article →
July 23, 2025
Where are the Opportunities in (NARI)
Read article →
July 12, 2025
(NARI) Pivots Trading Plans and Risk Controls
Read article →
July 02, 2025
(NARI) Investment Analysis
Read article →
June 21, 2025
(NARI) On The My Stocks Page
Read article →
June 11, 2025
When (NARI) Moves Investors should Listen
Read article →
May 29, 2025
Where are the Opportunities in (NARI)
Read article →
May 19, 2025
(NARI) Pivots Trading Plans and Risk Controls
Read article →
May 09, 2025
(NARI) Technical Data
Read article →
April 23, 2025
How to Take Advantage of moves in (NARI)
Read article →
April 07, 2025
Trading (NARI) With Integrated Risk Controls
Read article →
March 28, 2025
When (NARI) Moves Investors should Listen
Read article →
March 17, 2025
Objective long/short (NARI) Report
Read article →
February 18, 2025
How to Take Advantage of moves in (NARI)
Read article →
February 07, 2025
(NARI) Technical Pivots with Risk Controls
Read article →
Our Specialized Tools
Institutional-Grade Research
Risk Control
Evitar Corte
Protection from market crashes. We help investors identify every crash since 2000, in advance, using our proprietary model.
Learn more →
Macro Indicator
The Investment Rate (IR)
A measure of natural liquidity. The IR identified the bookends of every long-term stock market cycle since 1900.
Learn more →
Strategy
Investment Approach
With a macro foundation, we offer actionable investment strategies that allow clients to make money in any market environment.
Learn more →