Growth Rate - Quarterly CHART
Navigant Consulting (NCI) — Growth Rate - Quarterly
Fundamental data and historical chart analysis for Navigant Consulting — powered by Stock Traders Daily research.
NCI Growth Rate - Quarterly Chart
Updated daily
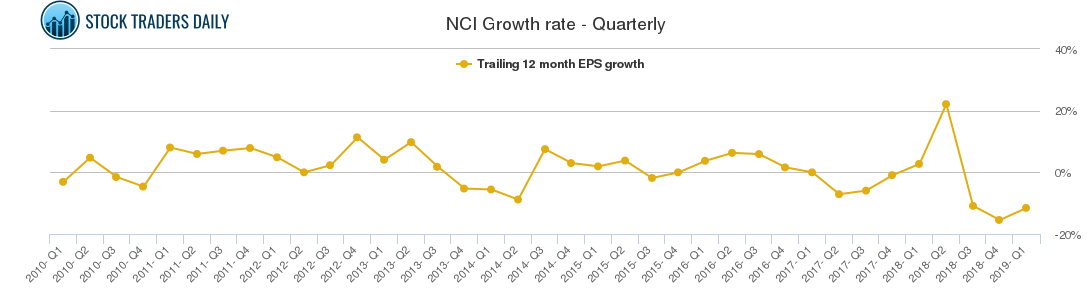
What is a Quarterly Growth Rate?
The quarterly growth rate measures the percentage change in a company's earnings per share compared to the same quarter one year ago. By comparing the same quarter across different years, this metric removes seasonal distortions and reveals the true underlying growth trend of the business.
Why Does It Matter?
Many businesses are inherently seasonal — retailers peak at the holidays, construction slows in winter, travel surges in summer. Comparing a quarter directly to the prior quarter can be misleading. The year over year quarterly comparison gives investors a cleaner signal of whether the business is genuinely improving.
How to Read the Chart
A consistently positive quarterly growth rate indicates the company is earning more per share than it did a year ago. Accelerating growth — where each quarter shows a higher growth rate than the previous — is particularly bullish. Decelerating or negative growth warrants further investigation into the cause.
What Influences Quarterly Growth?
Quarterly growth rates are affected by revenue trends, margin changes, one-time items, share buybacks, and the difficulty or ease of the comparison period from the prior year.
Past Coverage
News & Analysis — NCI
January 24, 2020
Invalid Iqfeed Symbol $NCI Trading Report
Read article →
January 15, 2020
Invalid Iqfeed Symbol $NCI Trading Report
Read article →
January 05, 2020
2019-10-10 $NCI Trading Report
Read article →
December 26, 2019
Invalid Iqfeed Symbol $NCI Trading Report
Read article →
December 17, 2019
Invalid Iqfeed Symbol $NCI Trading Report
Read article →
December 07, 2019
Invalid Iqfeed Symbol $NCI Trading Report
Read article →
November 27, 2019
Navigant Consulting Inc. $NCI Trading Report
Read article →
November 18, 2019
Navigant Consulting Inc. $NCI Trading Report
Read article →
November 08, 2019
Navigant Consulting Inc. $NCI Trading Report
Read article →
October 29, 2019
Navigant Consulting Inc. $NCI Trading Report
Read article →
October 20, 2019
Navigant Consulting Inc. $NCI Trading Report
Read article →
October 10, 2019
Navigant Consulting $NCI Trading Report
Read article →
October 01, 2019
Navigant Consulting $NCI Trading Report
Read article →
September 21, 2019
Navigant Consulting $NCI Trading Report
Read article →
September 11, 2019
Navigant Consulting $NCI Trading Report
Read article →
Our Specialized Tools
Institutional-Grade Research
Risk Control
Evitar Corte
Protection from market crashes. We help investors identify every crash since 2000, in advance, using our proprietary model.
Learn more →
Macro Indicator
The Investment Rate (IR)
A measure of natural liquidity. The IR identified the bookends of every long-term stock market cycle since 1900.
Learn more →
Strategy
Investment Approach
With a macro foundation, we offer actionable investment strategies that allow clients to make money in any market environment.
Learn more →