Growth Rate - Yearly CHART
Priceline.com . (PCLN) — Growth Rate - Yearly
Fundamental data and historical chart analysis for Priceline.com . — powered by Stock Traders Daily research.
PCLN Growth Rate - Yearly Chart
Updated daily
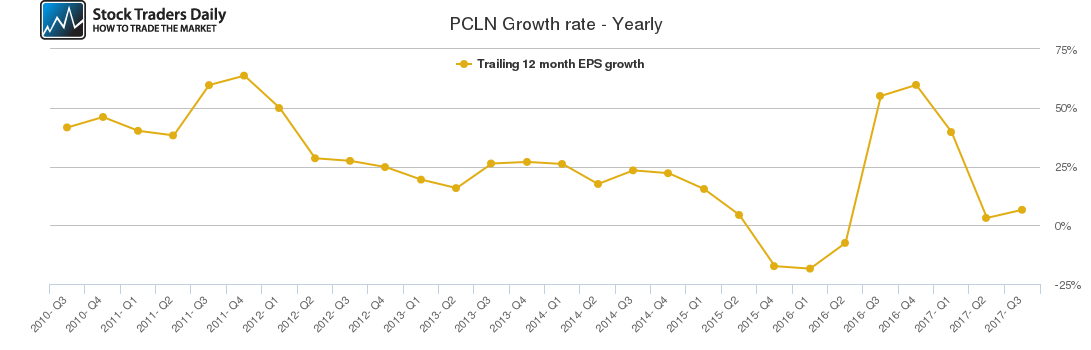
What is a Yearly Growth Rate?
A yearly growth rate measures how much a company's earnings per share has changed compared to the same period one year ago. It is expressed as a percentage and gives investors a clear view of whether a company is growing, shrinking, or staying flat on an annual basis.
Why Does It Matter?
Annual growth rates smooth out the seasonal fluctuations that can distort quarterly numbers. Because many businesses have strong and weak seasons, the yearly comparison gives a more reliable picture of the underlying growth trend of the business over time.
How to Read the Chart
A rising yearly growth rate indicates that earnings are accelerating — the company is growing faster than it was before. A declining growth rate, even if still positive, signals that growth is slowing. When the line crosses below zero, the company is earning less per share than it did a year ago, which can be a warning sign.
What Causes Changes in Yearly Growth Rate?
Growth rates can be influenced by revenue increases, cost cutting, share buybacks, or one-time events. Investors typically look for companies with consistent, sustainable growth rates rather than those driven by temporary factors.
Past Coverage
News & Analysis — PCLN
January 02, 2019
$PCLN Technical Update
Read article →
December 21, 2018
$PCLN Technical Update
Read article →
December 08, 2018
$PCLN Technical Update
Read article →
November 26, 2018
$PCLN Technical Update
Read article →
November 13, 2018
$PCLN Technical Update
Read article →
November 01, 2018
$PCLN Technical Update
Read article →
October 21, 2018
$PCLN Technical Update
Read article →
October 10, 2018
$PCLN Technical Update
Read article →
September 29, 2018
$PCLN Technical Update
Read article →
September 19, 2018
$PCLN Technical Update
Read article →
September 08, 2018
$PCLN Technical Update
Read article →
August 28, 2018
$PCLN Technical Update
Read article →
August 17, 2018
$PCLN Technical Update
Read article →
Our Specialized Tools
Institutional-Grade Research
Risk Control
Evitar Corte
Protection from market crashes. We help investors identify every crash since 2000, in advance, using our proprietary model.
Learn more →
Macro Indicator
The Investment Rate (IR)
A measure of natural liquidity. The IR identified the bookends of every long-term stock market cycle since 1900.
Learn more →
Strategy
Investment Approach
With a macro foundation, we offer actionable investment strategies that allow clients to make money in any market environment.
Learn more →