Dividend CHART
Pnc Financial Svcs Grp (PNC) — Dividend
Fundamental data and historical chart analysis for Pnc Financial Svcs Grp — powered by Stock Traders Daily research.
PNC Dividend Chart
Updated daily
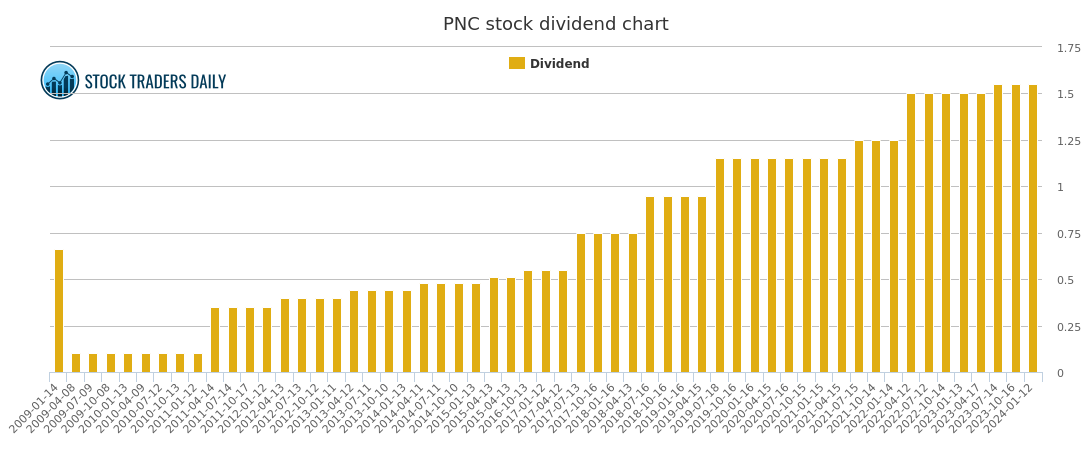
What is a Dividend Chart?
A dividend chart shows the history of cash payments a company has made to its shareholders over time. Dividends are typically paid quarterly and represent a direct share of the company's profits returned to investors.
Why Does It Matter?
Dividends are a key component of total return for long term investors. A consistent or growing dividend history signals financial stability and management's confidence in future earnings. Companies that regularly raise their dividends are often considered among the most financially sound businesses in the market.
How to Read the Chart
A rising dividend over time indicates that the company has been able to generate increasing cash flow and has chosen to return more of it to shareholders. A dividend cut is often viewed negatively by the market and can signal financial stress. A flat dividend is not necessarily negative — some companies prefer to reinvest profits for growth.
What Influences Dividend Levels?
Dividend payments depend on a company's free cash flow, payout policy, debt levels, and growth ambitions. Mature, stable businesses in sectors like utilities, consumer staples, and financials tend to pay the most consistent dividends.
Past Coverage
News & Analysis — PNC
July 16, 2026
(PNC) Risk Channels and Responsive Allocation
Read article →
July 04, 2026
(PNC) Risk Channels and Responsive Allocation
Read article →
June 23, 2026
(PNC) Movement as an Input in Quant Signal Sets
Read article →
June 12, 2026
Liquidity Mapping Around (PNC) Price Events
Read article →
June 01, 2026
Why (PNC) Price Action Is Critical for Tactical Trading
Read article →
May 21, 2026
Understanding Momentum Shifts in (PNC)
Read article →
May 10, 2026
Avoiding Lag: Real-Time Signals in (PNC) Movement
Read article →
April 29, 2026
Discipline and Rules-Based Execution in PNC Response
Read article →
April 18, 2026
Behavioral Patterns of PNC and Institutional Flows
Read article →
April 07, 2026
(PNC) Movement Within Algorithmic Entry Frameworks
Read article →
March 27, 2026
How (PNC) Movements Inform Risk Allocation Models
Read article →
March 16, 2026
Trading Systems Reacting to (PNC) Volatility
Read article →
March 05, 2026
How Pnc Financial Services Group Inc. (the) (PNC) Affects Rotational Strategy Timing
Read article →
February 22, 2026
(PNC) and the Role of Price-Sensitive Allocations
Read article →
February 11, 2026
Responsive Playbooks and the PNC Inflection
Read article →
Our Specialized Tools
Institutional-Grade Research
Risk Control
Evitar Corte
Protection from market crashes. We help investors identify every crash since 2000, in advance, using our proprietary model.
Learn more →
Macro Indicator
The Investment Rate (IR)
A measure of natural liquidity. The IR identified the bookends of every long-term stock market cycle since 1900.
Learn more →
Strategy
Investment Approach
With a macro foundation, we offer actionable investment strategies that allow clients to make money in any market environment.
Learn more →