Stock CHART
Powershares S&p Smallcap Information Tech Ptf (PSCT) — Stock
Fundamental data and historical chart analysis for Powershares S&p Smallcap Information Tech Ptf — powered by Stock Traders Daily research.
PSCT Stock Chart
Updated daily
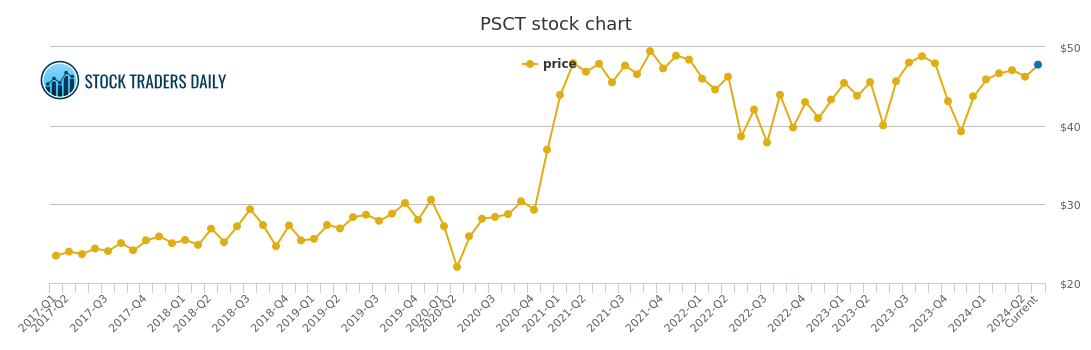
What is a Stock Price Chart?
A stock price chart displays the historical price of a company's shares over time. Each point on the chart represents the closing price of the stock on a given date, giving investors a visual record of how the market has valued the company across different periods.
Why Does It Matter?
Price history reveals patterns in how a stock behaves — periods of steady growth, sharp declines, recoveries, and consolidation. Understanding price history helps investors put current prices in context and identify whether a stock is trading near historical highs, lows, or somewhere in between.
How to Read the Chart
A consistently rising price line indicates that the market has been willing to pay more for the stock over time, generally reflecting improving business fundamentals or investor confidence. A declining trend may reflect deteriorating earnings, broader market weakness, or company-specific challenges.
What Influences Stock Price?
Stock prices are driven by earnings growth, interest rates, investor sentiment, macroeconomic conditions, and supply and demand for shares. Price alone tells only part of the story — it is most useful when analyzed alongside fundamental metrics like EPS, revenue, and valuation ratios.
Past Coverage
News & Analysis — PSCT
July 20, 2026
Why (PSCT) Price Action Is Critical for Tactical Trading
Read article →
July 09, 2026
Why (PSCT) Price Action Is Critical for Tactical Trading
Read article →
June 28, 2026
Understanding Momentum Shifts in (PSCT)
Read article →
June 17, 2026
Avoiding Lag: Real-Time Signals in (PSCT) Movement
Read article →
June 06, 2026
Discipline and Rules-Based Execution in PSCT Response
Read article →
May 26, 2026
Behavioral Patterns of PSCT and Institutional Flows
Read article →
May 15, 2026
(PSCT) Movement Within Algorithmic Entry Frameworks
Read article →
May 04, 2026
How (PSCT) Movements Inform Risk Allocation Models
Read article →
April 23, 2026
Trading Systems Reacting to (PSCT) Volatility
Read article →
April 12, 2026
How Powershares S&p Smallcap Information Tech Ptf (PSCT) Affects Rotational Strategy Timing
Read article →
April 01, 2026
(PSCT) and the Role of Price-Sensitive Allocations
Read article →
March 21, 2026
Responsive Playbooks and the PSCT Inflection
Read article →
March 09, 2026
Understanding the Setup: (PSCT) and Scalable Risk
Read article →
February 26, 2026
The Technical Signals Behind (PSCT) That Institutions Follow
Read article →
February 15, 2026
Precision Trading with Powershares S&p Smallcap Information Tech Ptf (PSCT) Risk Zones
Read article →
Our Specialized Tools
Institutional-Grade Research
Risk Control
Evitar Corte
Protection from market crashes. We help investors identify every crash since 2000, in advance, using our proprietary model.
Learn more →
Macro Indicator
The Investment Rate (IR)
A measure of natural liquidity. The IR identified the bookends of every long-term stock market cycle since 1900.
Learn more →
Strategy
Investment Approach
With a macro foundation, we offer actionable investment strategies that allow clients to make money in any market environment.
Learn more →