Stock CHART
Return Stacked U.s. Stocks & Managed Futures Etf (RSST) — Stock
Fundamental data and historical chart analysis for Return Stacked U.s. Stocks & Managed Futures Etf — powered by Stock Traders Daily research.
RSST Stock Chart
Updated daily
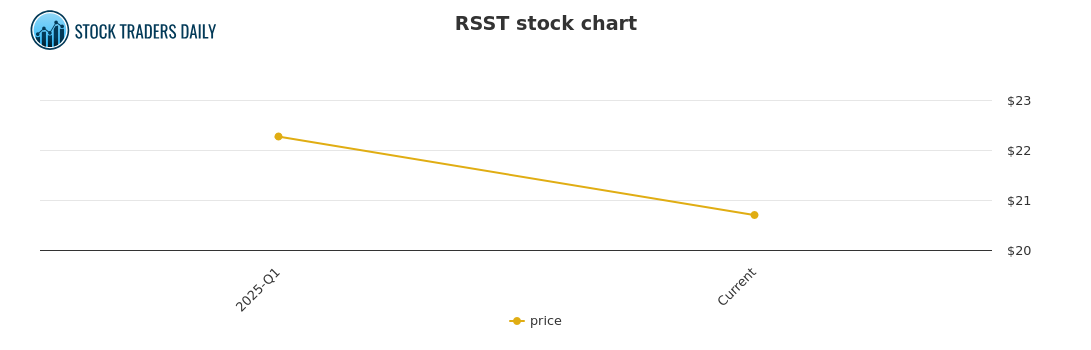
What is a Stock Price Chart?
A stock price chart displays the historical price of a company's shares over time. Each point on the chart represents the closing price of the stock on a given date, giving investors a visual record of how the market has valued the company across different periods.
Why Does It Matter?
Price history reveals patterns in how a stock behaves — periods of steady growth, sharp declines, recoveries, and consolidation. Understanding price history helps investors put current prices in context and identify whether a stock is trading near historical highs, lows, or somewhere in between.
How to Read the Chart
A consistently rising price line indicates that the market has been willing to pay more for the stock over time, generally reflecting improving business fundamentals or investor confidence. A declining trend may reflect deteriorating earnings, broader market weakness, or company-specific challenges.
What Influences Stock Price?
Stock prices are driven by earnings growth, interest rates, investor sentiment, macroeconomic conditions, and supply and demand for shares. Price alone tells only part of the story — it is most useful when analyzed alongside fundamental metrics like EPS, revenue, and valuation ratios.
Past Coverage
News & Analysis — RSST
July 12, 2026
Precision Trading with Return Stacked U.s. Stocks & Managed Futures Etf (RSST) Risk Zones
Read article →
July 01, 2026
Technical Reactions to RSST Trends in Macro Strategies
Read article →
June 20, 2026
Trading the Move, Not the Narrative: (RSST) Edition
Read article →
June 09, 2026
(RSST) Volatility Zones as Tactical Triggers
Read article →
May 29, 2026
Price-Driven Insight from (RSST) for Rule-Based Strategy
Read article →
May 18, 2026
(RSST) Price Dynamics and Execution-Aware Positioning
Read article →
May 07, 2026
(RSST) as a Liquidity Pulse for Institutional Tactics
Read article →
April 26, 2026
(RSST) Risk Channels and Responsive Allocation
Read article →
April 15, 2026
(RSST) Movement as an Input in Quant Signal Sets
Read article →
April 04, 2026
Liquidity Mapping Around (RSST) Price Events
Read article →
March 24, 2026
Why (RSST) Price Action Is Critical for Tactical Trading
Read article →
March 13, 2026
Understanding Momentum Shifts in (RSST)
Read article →
March 02, 2026
Avoiding Lag: Real-Time Signals in (RSST) Movement
Read article →
February 19, 2026
Discipline and Rules-Based Execution in RSST Response
Read article →
February 08, 2026
Behavioral Patterns of RSST and Institutional Flows
Read article →
Our Specialized Tools
Institutional-Grade Research
Risk Control
Evitar Corte
Protection from market crashes. We help investors identify every crash since 2000, in advance, using our proprietary model.
Learn more →
Macro Indicator
The Investment Rate (IR)
A measure of natural liquidity. The IR identified the bookends of every long-term stock market cycle since 1900.
Learn more →
Strategy
Investment Approach
With a macro foundation, we offer actionable investment strategies that allow clients to make money in any market environment.
Learn more →