PEG CHART
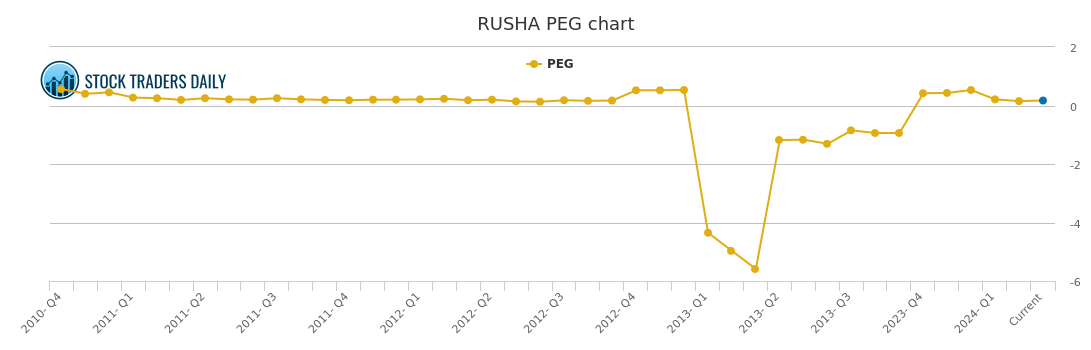
Rush Enterprises (RUSHA) — PEG
Fundamental data and historical chart analysis for Rush Enterprises — powered by Stock Traders Daily research.
RUSHA PEG Chart
Updated daily
What is the PEG Ratio?
The Price/Earnings to Growth ratio (PEG) builds on the P/E ratio by factoring in a company's expected earnings growth rate. It is calculated by dividing the P/E ratio by the annual earnings growth rate. A PEG of 1.0 is generally considered fairly valued — below 1.0 may indicate undervaluation relative to growth, above 1.0 may indicate overvaluation.
Why Does It Matter?
The P/E ratio alone does not tell you whether a company's valuation is justified by its growth prospects. A company with a P/E of 30 might be cheap if it is growing earnings at 40% per year, but expensive if earnings are flat. The PEG ratio adds this crucial growth dimension to valuation analysis.
How to Read the Chart
A declining PEG ratio over time can indicate that a stock is becoming more attractively valued relative to its growth. A rising PEG suggests the stock may be getting ahead of its fundamentals. Comparing a company's PEG to its historical range and industry peers provides the most useful context.
What Influences the PEG Ratio?
The PEG ratio is sensitive to changes in both the stock price and earnings growth expectations. Rapid changes in analyst growth forecasts or significant price movements can cause the PEG to shift quickly.
Past Coverage
News & Analysis — RUSHA
July 09, 2026
Why (RUSHA) Price Action Is Critical for Tactical Trading
Read article →
June 28, 2026
Understanding Momentum Shifts in (RUSHA)
Read article →
June 17, 2026
Avoiding Lag: Real-Time Signals in (RUSHA) Movement
Read article →
June 06, 2026
Discipline and Rules-Based Execution in RUSHA Response
Read article →
May 26, 2026
Behavioral Patterns of RUSHA and Institutional Flows
Read article →
May 15, 2026
(RUSHA) Movement Within Algorithmic Entry Frameworks
Read article →
May 04, 2026
How (RUSHA) Movements Inform Risk Allocation Models
Read article →
April 23, 2026
Trading Systems Reacting to (RUSHA) Volatility
Read article →
April 12, 2026
How Rush Enterprises Inc. Class A Common Stock (RUSHA) Affects Rotational Strategy Timing
Read article →
April 01, 2026
(RUSHA) and the Role of Price-Sensitive Allocations
Read article →
March 21, 2026
Responsive Playbooks and the RUSHA Inflection
Read article →
March 10, 2026
Understanding the Setup: (RUSHA) and Scalable Risk
Read article →
February 27, 2026
The Technical Signals Behind (RUSHA) That Institutions Follow
Read article →
February 16, 2026
Precision Trading with Rush Enterprises Inc. Class A Common Stock (RUSHA) Risk Zones
Read article →
February 05, 2026
Technical Reactions to RUSHA Trends in Macro Strategies
Read article →
Our Specialized Tools
Institutional-Grade Research
Risk Control
Evitar Corte
Protection from market crashes. We help investors identify every crash since 2000, in advance, using our proprietary model.
Learn more →
Macro Indicator
The Investment Rate (IR)
A measure of natural liquidity. The IR identified the bookends of every long-term stock market cycle since 1900.
Learn more →
Strategy
Investment Approach
With a macro foundation, we offer actionable investment strategies that allow clients to make money in any market environment.
Learn more →