Stock CHART
Teletech (TTEC) — Stock
Fundamental data and historical chart analysis for Teletech — powered by Stock Traders Daily research.
TTEC Stock Chart
Updated daily
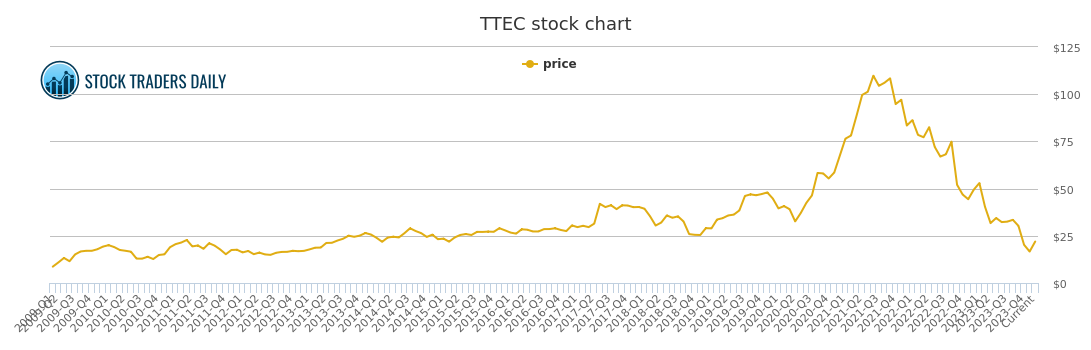
What is a Stock Price Chart?
A stock price chart displays the historical price of a company's shares over time. Each point on the chart represents the closing price of the stock on a given date, giving investors a visual record of how the market has valued the company across different periods.
Why Does It Matter?
Price history reveals patterns in how a stock behaves — periods of steady growth, sharp declines, recoveries, and consolidation. Understanding price history helps investors put current prices in context and identify whether a stock is trading near historical highs, lows, or somewhere in between.
How to Read the Chart
A consistently rising price line indicates that the market has been willing to pay more for the stock over time, generally reflecting improving business fundamentals or investor confidence. A declining trend may reflect deteriorating earnings, broader market weakness, or company-specific challenges.
What Influences Stock Price?
Stock prices are driven by earnings growth, interest rates, investor sentiment, macroeconomic conditions, and supply and demand for shares. Price alone tells only part of the story — it is most useful when analyzed alongside fundamental metrics like EPS, revenue, and valuation ratios.
Past Coverage
News & Analysis — TTEC
December 10, 2024
How to Take Advantage of moves in (TTEC)
Read article →
November 30, 2024
(TTEC) Technical Pivots with Risk Controls
Read article →
October 28, 2024
Trend Tracker for (TTEC)
Read article →
October 18, 2024
(TTEC) Long Term Investment Analysis
Read article →
October 07, 2024
Learn to Evaluate (TTEC) using the Charts
Read article →
August 04, 2024
Long Term Trading Analysis for (TTEC)
Read article →
July 25, 2024
(TTEC) Investment Analysis
Read article →
July 15, 2024
How to Take Advantage of moves in (TTEC)
Read article →
July 05, 2024
(TTEC) Trading Report
Read article →
June 25, 2024
(TTEC) Pivots Trading Plans and Risk Controls
Read article →
June 15, 2024
Trend Tracker for (TTEC)
Read article →
June 03, 2024
(TTEC) Trading Report
Read article →
May 24, 2024
How the (TTEC) price action is used to our Advantage
Read article →
May 14, 2024
Learn to Evaluate (TTEC) using the Charts
Read article →
May 04, 2024
Where are the Opportunities in (TTEC)
Read article →
Our Specialized Tools
Institutional-Grade Research
Risk Control
Evitar Corte
Protection from market crashes. We help investors identify every crash since 2000, in advance, using our proprietary model.
Learn more →
Macro Indicator
The Investment Rate (IR)
A measure of natural liquidity. The IR identified the bookends of every long-term stock market cycle since 1900.
Learn more →
Strategy
Investment Approach
With a macro foundation, we offer actionable investment strategies that allow clients to make money in any market environment.
Learn more →