EPS CHART
Vishay Intertech (VSH) — EPS
Fundamental data and historical chart analysis for Vishay Intertech — powered by Stock Traders Daily research.
VSH EPS Chart
Updated daily
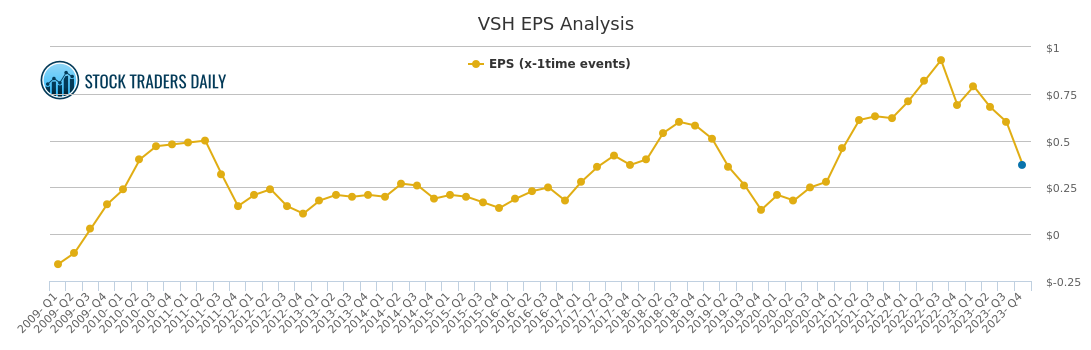
What is EPS?
Earnings Per Share (EPS) measures the portion of a company's net profit allocated to each outstanding share of common stock. It is calculated by dividing net income by the total number of shares outstanding and is one of the most widely used metrics for evaluating a company's profitability.
Why Does It Matter?
EPS allows investors to compare profitability across companies of different sizes on a per-share basis. A rising EPS over time generally indicates that a company is becoming more profitable, which tends to support a higher stock price. Declining EPS can signal deteriorating business conditions.
How to Read the Chart
The EPS chart uses a trailing twelve month (TTM) figure, which smooths out seasonal variations by always looking at the most recent full year of earnings. A rising line indicates improving profitability. A flat or declining line warrants closer examination of the underlying business.
What Causes EPS to Change?
EPS can rise due to higher revenues, improved profit margins, cost reductions, or share buybacks that reduce the number of shares outstanding. It can fall due to revenue declines, rising costs, or dilution from new share issuances.
Past Coverage
News & Analysis — VSH
July 16, 2026
Why (VSH) Price Action Is Critical for Tactical Trading
Read article →
July 05, 2026
Why (VSH) Price Action Is Critical for Tactical Trading
Read article →
June 24, 2026
Understanding Momentum Shifts in (VSH)
Read article →
June 13, 2026
Avoiding Lag: Real-Time Signals in (VSH) Movement
Read article →
June 02, 2026
Discipline and Rules-Based Execution in VSH Response
Read article →
May 22, 2026
Behavioral Patterns of VSH and Institutional Flows
Read article →
May 11, 2026
(VSH) Movement Within Algorithmic Entry Frameworks
Read article →
April 30, 2026
How (VSH) Movements Inform Risk Allocation Models
Read article →
April 19, 2026
Trading Systems Reacting to (VSH) Volatility
Read article →
April 08, 2026
How Vishay Intertechnology Inc. (VSH) Affects Rotational Strategy Timing
Read article →
March 28, 2026
(VSH) and the Role of Price-Sensitive Allocations
Read article →
March 17, 2026
Responsive Playbooks and the VSH Inflection
Read article →
March 06, 2026
Understanding the Setup: (VSH) and Scalable Risk
Read article →
February 22, 2026
The Technical Signals Behind (VSH) That Institutions Follow
Read article →
February 11, 2026
Precision Trading with Vishay Intertechnology Inc. (VSH) Risk Zones
Read article →
Our Specialized Tools
Institutional-Grade Research
Risk Control
Evitar Corte
Protection from market crashes. We help investors identify every crash since 2000, in advance, using our proprietary model.
Learn more →
Macro Indicator
The Investment Rate (IR)
A measure of natural liquidity. The IR identified the bookends of every long-term stock market cycle since 1900.
Learn more →
Strategy
Investment Approach
With a macro foundation, we offer actionable investment strategies that allow clients to make money in any market environment.
Learn more →