|
For June
11
, 2010
(Provided to you in advance of the Trading Session)
Summary:
Neutral resistance is now within striking distance.
Our combined midterm
analysis tells us that the neutral mid term channel that
we have been watching is likely to solidify soon.
Specifically, midterm neutral resistance is likely to be
tested soon, and that will confirm the channel again.
According to our combined midterm analysis, support
levels have held thus far. If those support levels
continue to hold, and because the market has already
begun to pull away, expect a test of resistance to
follow. Appropriately, our combined midterm
analysis tells us to expect a test of midterm neutral
resistance levels soon. If/when that happens,
treat resistance as inflection.
|
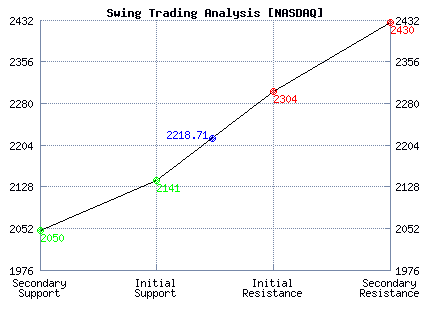
Initial intraday trading parameters for the NASDAQ
exist between
2141 - 2304 |
|
2141 lower expect
2050 |
|
If
2304 breaks higher expect
2430 |
| Otherwise expect
2141 - 2304 hold
|
This is an Overnight Snapshot
(real time updates are available in our alerts
viewer)
These Parameters are telling us to trade the Market
as follows...
RESISTANCE PLANS:
-
If 2304 is tested first, these charts tell us
to short with a downside target of 2141
-
However, if 2304 breaks higher these same Parameters are telling us to expect
2430
SUPPORT PLANS:
-
But, if
2141 is tested , these same Parameters tell
us to buy the Market with a target of 2304.
-
However, if
2141 breaks lower, these same Parameters are telling us to expect 2059
Our Automated Swing Trading Alerts Viewer
will alert you to tests automatically. Find the
link to this viewer in our Strategies Tab in the Main
Menu.
IMPORTANT: The rules of trading say that a test
of support or resistance Parameters occur in the NASDAQ
when the NASDAQ comes within 3 points of our trading
Parameter (15 points for the DOW and 1.5 points for
the S&P). When, for example, the Market comes within
3 points of a support level, and, according to rule,
we look for a long position, we would refer to the Focus
List at that exact time to find which stocks are best
to trade. In order for our system to work efficiently for Market-timing
purposes, we must look for trading ideas at the exact
time the Market offers us trading signals as indicated
from the Parameters above.
|