|
For June 11, 2010
(Individual Chart Analysis)
This is a no-frills analysis. It is not designed
to look good, it is designed to be effective.
Summary of the Technical Analysis for the DOW
(This takes into account the near term, mid term, and
longer term charts)
our combined analysis for Friday tells us to
expect the market to begin the day with a bias to increase. Overall, our
combined analysis is bullish. The longer-term charts are bullish, midterm
support levels have held, and the near-term charts shows is that breakouts have
already begun to occur. Combined, there is a bullish read stemming from
our analysis for Friday. If the market begins the day with a bias to
increase and if it holds above initial support levels, aggressive market
increases can follow. At least, midterm neutral resistance levels can be
tested. If this occurs it should be considered a test of inflection, but
midterm resistance is nicely higher than the close of the market on Thursday, so
such a move would also be construed as relatively bullish. Treat initial
support as inflection for Friday's trading session, and use it to guide your
decisions accordingly. If 10065 remains in tact as support expect the
market to increase to 10316. However, if 10065 breaks lower, expect 9869
instead.
|
Initial intraday trading parameters for the DOW
exist between 10065 and 10316 |
|
If
10065 breaks lower expect
9869 |
|
If 10316 breaks higher
expect 10908 |
|
Otherwise expect 10065 - 10316 |
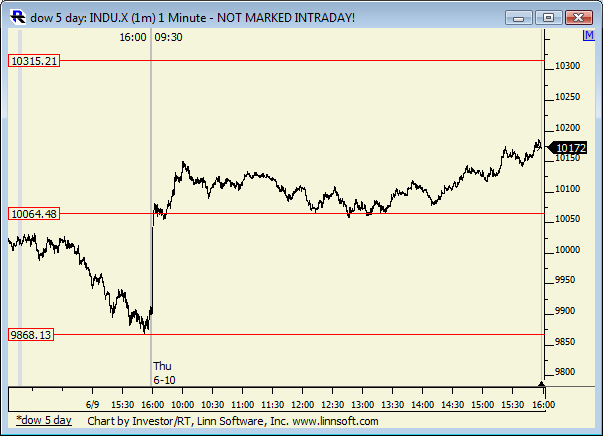
Near Term Chart Analysis for the DOW
Our combined
near-term analysis tells us the market is in a near-term neutral trading
channel. In addition, it tells us that the market has recently broken
above the neutral intra-channel resistance line that had been in tact.
This former level of resistance has since been converted into support and it is
inflection. If recently converted near term neutral intra-channel support
remains in tact expect the market to begin the day with a bias to increase on
Friday and expect a test of near term neutral resistance to follow.
Near Term Support for the DOW exists at 10065 then
9869
Near Term Resistance for the DOW exists at
10315
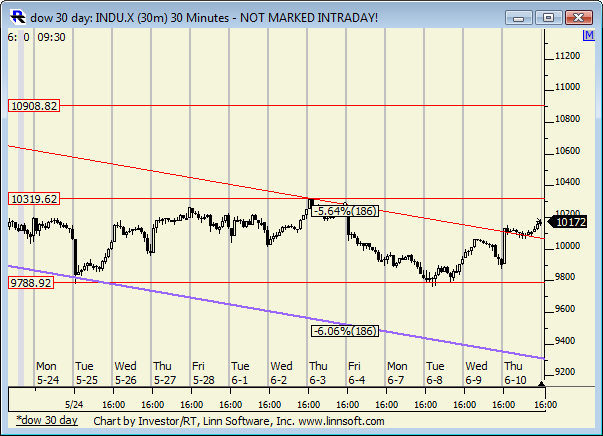
Mid Term Chart Analysis for the DOW
Support is holding, for
now...
Our combined midterm
analysis tells us that the neutral mid term channel that we have been watching
is likely to solidify soon. Specifically, midterm neutral resistance is
likely to be tested soon, and that will confirm the channel again.
According to our combined midterm analysis, support levels have held thus far.
If those support levels continue to hold, and because the market has already
begun to pull away, expect a test of resistance to follow. Appropriately,
our combined midterm analysis tells us to expect a test of midterm neutral
resistance levels soon. If/when that happens, treat resistance as
inflection.
Mid Term Support for the DOW exists at 9789
Mid Term Resistance for the DOW exists at 10319
then 10908
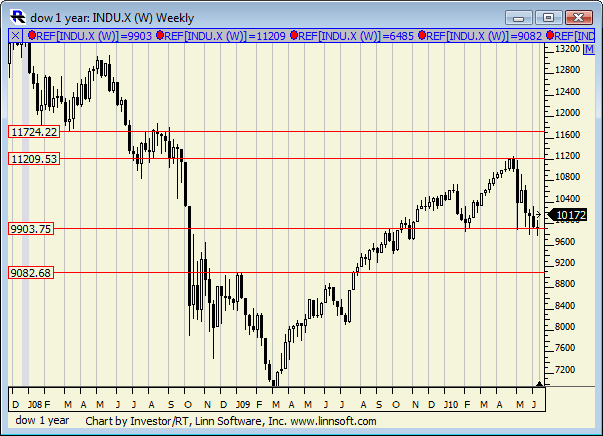
Longer Term Chart Analysis for the DOW
Our combined longer term
analysis tells us that the Market is threatening to
break longer term neutral support. This, when
combined with the reversal confirmation we pinpointed in
late April, suggests that aggressive breaks are likely
at some point. Treat support as inflection,
recognize that some markets have started to break below
longer term neutral support already, and prepare for
additional declines at some point as a result. A
slight bounce back is not uncommon, but the breach that
is obvious from some of the Markets we follow suggests
that an eventual turn lower should come. This sets
the stage for our longer term plans.
Longer Term Support for the DOW exists at 9904
Longer Term Resistance for the DOW exists at 11209
|