|
Summary:
Expect the Market to begin the day with a bias
to increase on Friday.
HEADS UP
(written before Monday and intended for the
entire week):
The Market is
retracing back to recent lows. The
question on everyone's mind is, will it continue
to decline this time? At first glance,
Friday was a knee jerk reaction, but everyone
seemed lined up to sell again. Will this
be a story that we here over and over again.
Will every bounce be met with sellers? If
so, the Market is likely to decline
substantially from current levels over time.
Technical
Analysis
|
Near Term Outlook
|
Our combined
near-term analysis tells us the market is in a near-term neutral trading
channel. In addition, it tells us that the market has recently broken
above the neutral intra-channel resistance line that had been in tact.
This former level of resistance has since been converted into support and it is
inflection. If recently converted near term neutral intra-channel support
remains in tact expect the market to begin the day with a bias to increase on
Friday and expect a test of near term neutral resistance to follow.
|
|
Mid Term Outlook |
Our combined midterm
analysis tells us that the neutral mid term channel that
we have been watching is likely to solidify soon.
Specifically, midterm neutral resistance is likely to be
tested soon, and that will confirm the channel again.
According to our combined midterm analysis, support
levels have held thus far. If those support levels
continue to hold, and because the market has already
begun to pull away, expect a test of resistance to
follow. Appropriately, our combined midterm
analysis tells us to expect a test of midterm neutral
resistance levels soon. If/when that happens,
treat resistance as inflection.
|
|
Long Term Outlook |
Our combined longer term
analysis tells us that the Market is threatening to
break longer term neutral support. This, when
combined with the reversal confirmation we pinpointed in
late April, suggests that aggressive breaks are likely
at some point. Treat support as inflection,
recognize that some markets have started to break below
longer term neutral support already, and prepare for
additional declines at some point as a result. A
slight bounce back is not uncommon, but the breach that
is obvious from some of the Markets we follow suggests
that an eventual turn lower should come. This sets
the stage for our longer term plans.
Special reports:
1. April 2010 - The
Reversal Confirmation
http://www.stocktradersdaily.com/may.htm
2. Game Plan
http://www.stocktradersdaily.com/short conversion2.pdf
3. 2010 - The Year of the increase:
http://www.stocktradersdaily.com/reports/2010.pdf
Dow parameters for Strategic Plan:
6485 - 9083 - 9904 - 10725 - 11724
|
YTD Return: |
Strategic |
Plan = |
39.12% |
Investment Rate:
We are long term Bears. We expect a GREATER DEPRESSION in
the next 5 - 10 years. The Investment Rate explains why. Find the
link in the Main Menu of our Members Area.
|
|
Combined
Analysis: We review the charts of all
major Markets for near, mid, and long
term catalysts. |
|
NASDAQ |
SP 500 |
DOW JONES |
Summary:
Friday's
analysis:
our combined
analysis for Friday tells us to expect the
market to begin the day with a bias to increase.
Overall, our combined analysis is bullish.
The longer-term charts are bullish, midterm
support levels have held, and the near-term
charts shows is that breakouts have already
begun to occur. Combined, there is a
bullish read stemming from our analysis for
Friday. If the market begins the day with
a bias to increase and if it holds above initial
support levels, aggressive market increases can
follow. At least, midterm neutral
resistance levels can be tested. If this
occurs it should be considered a test of
inflection, but midterm resistance is nicely
higher than the close of the market on Thursday,
so such a move would also be construed as
relatively bullish. Treat initial support
as inflection for Friday's trading session, and
use it to guide your decisions accordingly.
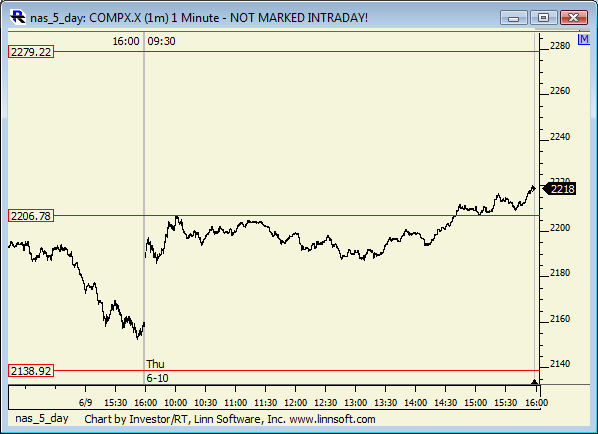
If 2207 remains in tact as support expect the
market to increase to 2279. However, if
2207 breaks lower, expect 2141 instead.
Performance Records: This
will be updated weekly, usually on Sundays.
These are all realized returns. They do
not include paper gains.
|
Updated weekly. Last update: 5.31.10 |
|
STRATEGY |
2008 Results |
2009 Results |
2010 YTD |
Long/Short? |
Risk Control? |
|
Strategic Plan |
19.17% |
31.73% |
32.39% |
Yes |
Yes |
|
Day Trading Alerts * |
129.44% |
2.99% |
23.47% |
Yes |
Yes |
|
Swing Trading Alerts * |
96.52% |
24.36% |
11.07% |
Yes |
Yes |
|
Stock of the Week |
84.40% |
13.01% |
13.28% |
Yes |
Yes |
|
Lock and Walk * |
n/a |
-11.74% |
15.20% |
Yes |
Yes |
|
Position Trades* |
|
58.70% |
19.95% |
Yes |
Yes |
|
DJIA |
-33.80% |
18.73% |
-2.80% |
No |
No |
Traders
Psychology
Traders are
opened eyed, and net buyers.
Economic
Reports
|
Jun 11 |
8:30 AM |
Retail Sales |
0.3% |
|
Jun 11 |
8:30 AM |
Retail Sales
ex-auto |
0.1% |
|
Jun 11 |
9:55 AM |
Mich
Sentiment |
74.8 |
|
Jun 11 |
10:00 AM |
Business
Inventories |
0.5% |
|
Potential
Market Moving Events
Market
Timing/Trading Approach:
We are Expert Market Timers. This
requires attention to strategy. We
offer 5 Strategies that encompass our Market
Timing Skills. These Strategies range
from Timing Strategies with 1-3 month
durations to Timing Strategies which open
and close the same day. Review our
Strategies to find the one (s) best suited
for you, and take our Boot Camp to jump
start your learning curve.
Day
Trading Results for the last session:
We issue accuracy ratings for the Day
Trading Parameters that we have provided for
the NASDAQ every day to evaluate if the
Trading Parameters that were offered for the
previous session helped us profit from day
trades. 1 = accurate (The
parameters helped us profit). 0 = Not
accurate (The parameters did not help us
profit
Accuracy Rating for the last trading
session: 0 = not Accurate
There were no
triggers on Thursday.
|
Initial
intraday trading parameters for the NASDAQ
exist between 2141 -
2209 |
|
If
2141 breaks lower expect
2059 |
|
If
2209 breaks higher expect
2304 |
|
Otherwise
expect 2141 - 2209
to hold |
|
2209 was
mid channel at the end of the day, but
it held early.
Good Trading,
Thomas
H. Kee Jr.
|